Creating a scale bar for a mapLaura TwardochlebSeptember 21, 2016Here I have modified a function to create a scale bar for a map. I will use an example map of black bear occurrences in the northeastern United States. The original code for the scale bar function was written by eipi10 at http://stackoverflow.com/questions/23784943/how-to-add-a-scale-bar-in-r
I will create the map of the northeast region and plot black bear occurrence data from GBIF (Global Biodiversity Information Facility) using the ‘raster’ library.
The above code produced a map with 100 km x 100 km resolution of bear occurrence data. Now I will add a custom scale bar illustrating 100 km on the map.
0 Comments
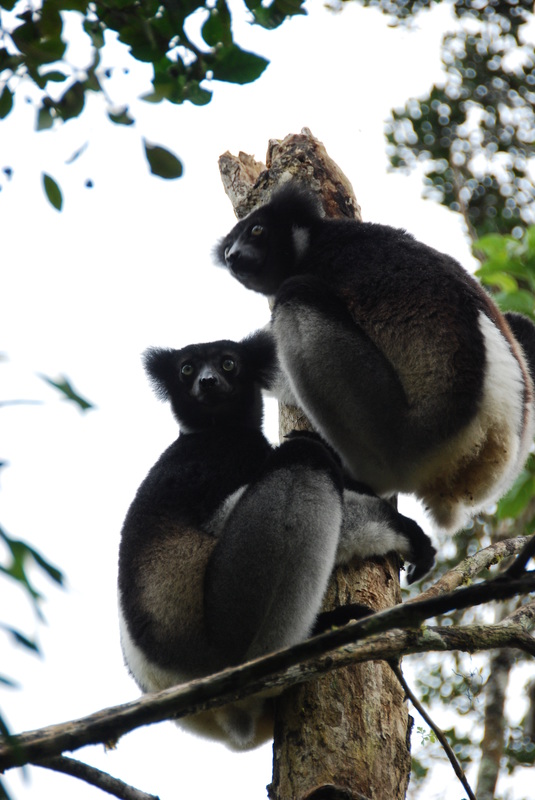
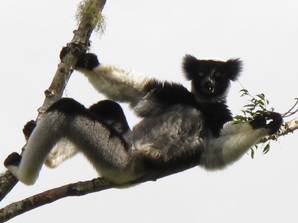
Spatial Data: Global Species Occurrences from GBIFData Category: Species Occurrences Data Description: GBIF is the Global Biodiversity Information Facility which provides free and open access to biodiversity data. Spatial and temporal scale of occurrences varies, depending on the species of interest. Data Link: http://www.gbif.org/ Data Use Policy: http://www.gbif.org/using-data/summary Use with R: GBIF data on species occurrences can be downloaded directly for certain species by using the R package “dismo”, as shown below for Indri indri (the largest living lemur). For use with software other than R, work through add different filters to download occurrence data here: http://www.gbif.org/occurrence/search
Clip points to polygon shapefileOpen packages needed to use this snippet and the data.*
Project the data.
Plot the shapefile and dataset.
Notice that the puma data is global. Often clipping can be difficult to write out, but R lets you simply subset the puma data based on the US data:
Now you only have data for the US!
|
Spatial Ecology @ MSUClick on "Category" below to search for R code compiled by the Zarnetske Spatial & Community Ecology Lab and students in MSU's Spatial Ecology graduate course (FOR870/FW870) Category
All
Archive
October 2016
|


 RSS Feed
